Back to Home
Market Insights
Research, analysis, and comparisons for developers and teams building with financial data APIs and AI agents.
 Synthesis -Apr 6, 2026
How AI Agents Interpret Market Moves in Real Time
OHLCV candles show what happened but not why. Regime context, macro backdrop, and cross-asset signals turn identical price action into opposite conclusions.
 Tutorial -Apr 4, 2026
How to Build a Financial Data MCP Server
Architecture decisions, tool design patterns, and production lessons from building an MCP server that delivers pre-analyzed market context to AI agents.
 Guide -Apr 3, 2026
From Raw Data to Agent-Ready Context
The operational cost of turning 5 API calls into one decision-ready input. Pipeline steps, token math, and why pre-analyzed context outperforms DIY formatting.
 Synthesis -Apr 3, 2026
Bitcoin Market Regimes: Why the Same -5% Means Different Things
Why single indicators fail and how multi-factor systems detect risk-on, risk-off, and transition states for automated systems.
 Comparison -Apr 1, 2026
7 Bitcoin APIs Compared: What Each One Actually Returns (2026)
7 APIs compared on data scope, MCP support, x402 micropayments, and token efficiency for LLMs.
 Network -Mar 31, 2026
Bitcoin Hash Rate: What Hundreds of Exahashes Actually Tell You
800+ exahashes per second. How mining difficulty, halvings, and hash rate trends reflect miner economics.
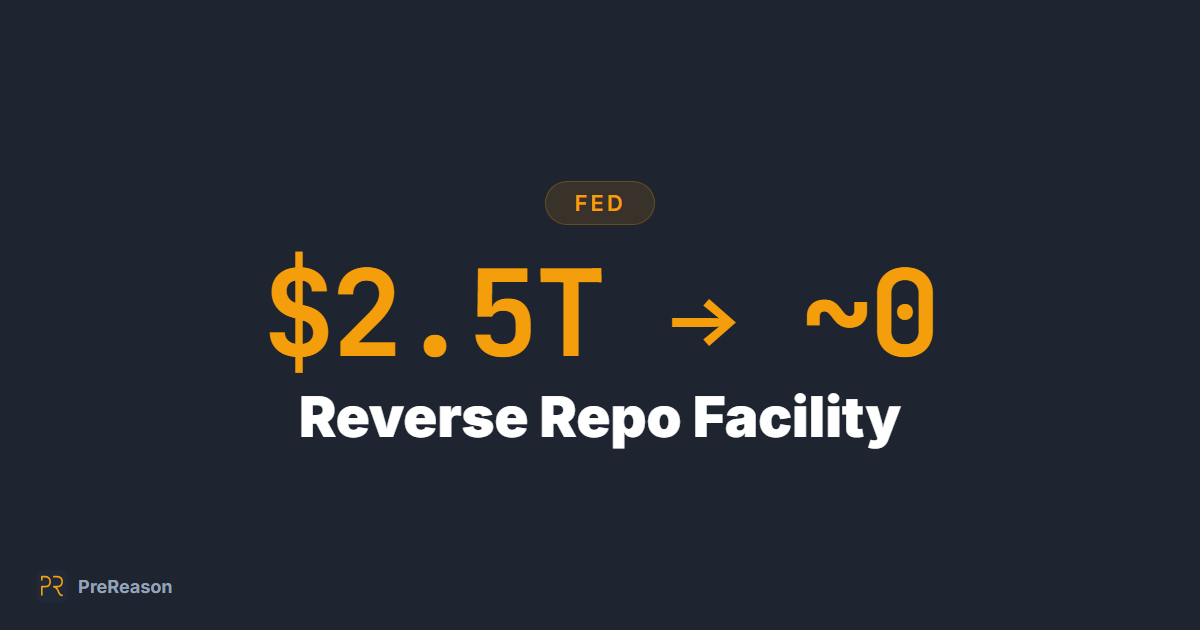 Fed -Mar 31, 2026
Reverse Repo (RRP): How $2 Trillion Drains From Markets Overnight
The largest single liquidity variable of 2022-2024 is now nearly empty. Where the money went.
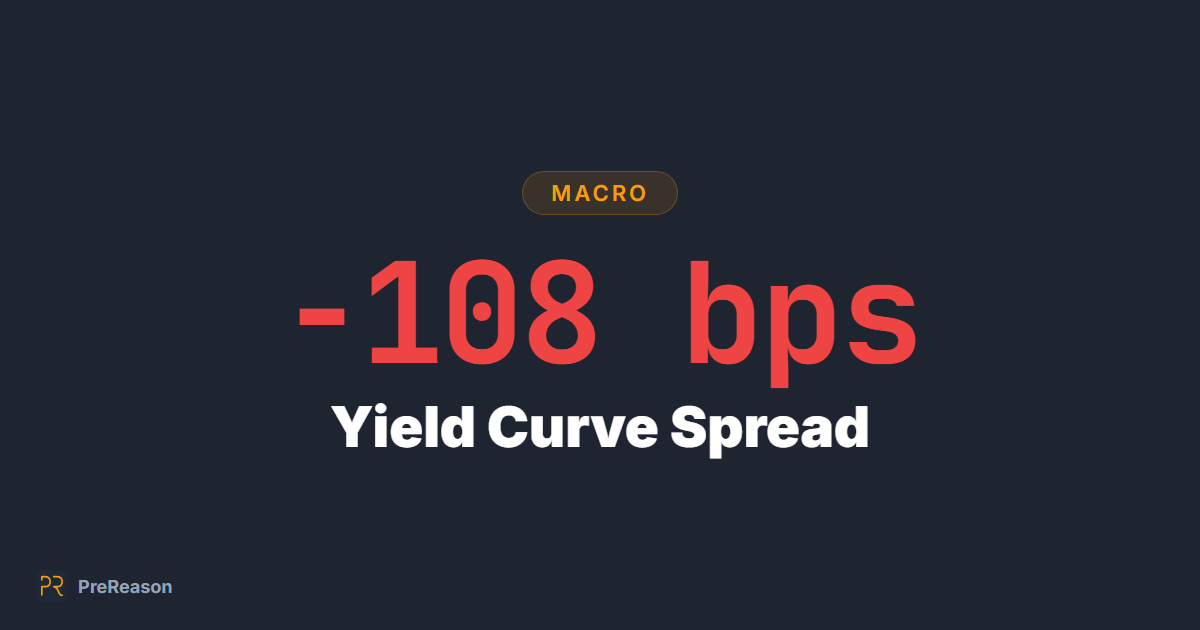 Macro -Mar 30, 2026
The Yield Curve Spread and the US Recession Record Since 1970
What the 10Y minus 2Y spread measures, and its inversions before each US recession since 1970.
 On-Chain -Mar 30, 2026
Hash Ribbons: Miner Capitulation and Recovery in the Hash Rate
When miners shut down, the hash rate shows it. How the 30 day and 60 day averages mark capitulation and recovery.
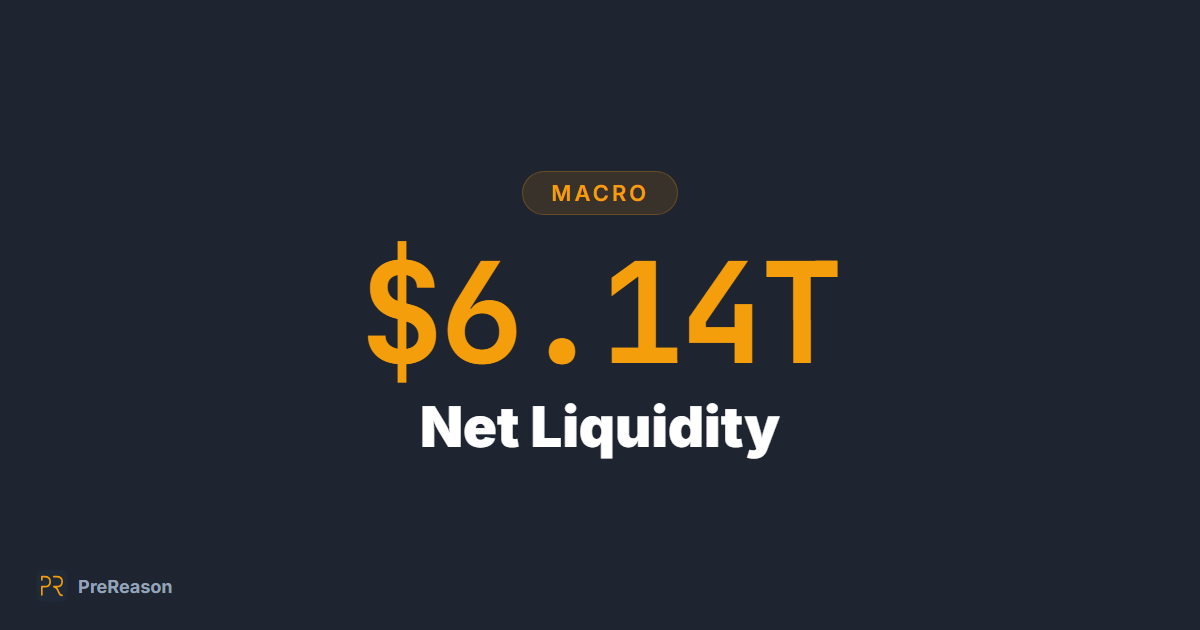 Macro -Mar 30, 2026
Net Liquidity Explained: Fed Balance Sheet Minus RRP Minus TGA
One number. Three Fed components. Widely read against Bitcoin since 2020.
Looking for API documentation? See all metrics or 33 market briefings.